
手头有个小机器,偶尔拿出来玩玩,又重新折腾了一遍,深感每次重复操作,因为想法比较多,各种东西装一下,重新要到处翻帖子,今天直接把过程整理一遍,以后再来不用那么手忙脚乱。
前提:基于OPI官方 Orangepizero2_2.2.0_ubuntu_focal_desktop_linux4.9.170 镜像,理论上只要是Ubuntu应该都问题不大,其他的肯定是不行的,Axx Uxx等基于相同Linux基础的估计要确认不保证;烧录TF卡,略,实在没啥可说。
为了避免操作麻烦,以下全为 root 用户直接登录 省了 sudo 方法
1,安装 VNC,方便操作,图形化嘛
// 安装 tightvncserver
apt install tightvncserver
// 编辑开机启动脚本
vi /etc/init.d/tightvncserver
#!/bin/sh
export USER='root'
eval cd ~$USER
case "$1" in
start)
# 启动命令行。此处自定义分辨率、控制台号码或其它参数。
su $USER -c '/usr/bin/tightvncserver -depth 16 -geometry 800x600 :1'
echo "Starting TightVNC server for $USER "
;;
stop)
# 终止命令行。此处控制台号码与启动一致。
su $USER -c '/usr/bin/tightvncserver -kill :1'
echo "Tightvncserver stopped"
;;
*)
echo "Usage: /etc/init.d/tightvncserver {start|stop}"
exit 1
;;
esac
exit 0// 赋权 开机启动
chmod 755 /etc/init.d/tightvncserver
update-rc.d tightvncserver defaults2,安装Docker
// 安装Docker
curl -sSL https://get.docker.com | sh
// 启动Docker
service docker start
// 状态确认
service docker status
// 不放心可以装个 Hello-world
 docker run hello-world
接下来,安装 Portainer 方便图形化管理Docker 虽说命令也很方便
docker run -d -p 9000:9000 --restart=always -v "/var/run/docker.sock:/var/run/docker.sock" --name prtainer portainer/portainer
// 要加: -v "/var/run/docker.sock:/var/run/docker.sock"
正常执行完,应该浏览器就能打开网站了 : http://IP:9000/;
备注1:这里因为刚装,有可能不能解析主机,也有可能…GFW
// 修改 /etc/resolv.conf 添加 DNS解析(重启失效):
vi /etc/resolv.conf
nameserver 192.168.0.1
nameserver 4.2.2.2
// 如果没问题,编辑 /etc/systemd/resolved.conf 文件添加DNS情报 (重启有效)
vi /etc/systemd/resolved.conf
DNS=4.2.2.2 8.8.4.4
备注2:因为portainer的templates 镜像在 raw.githubusercontent.com 上, 由于众所周知的原因,天朝被墙,所以被迫网上找下真实IP,修改本地 HOST (/etc/hosts)文件;(或者找个梯子)
185.199.109.133 raw.githubusercontent.com
//之所以备注,这个方法现在被我用来屏蔽电视机广告,
备注3:在OPI Zero2上可以跑的模板 filebrowser/filebrowser:latest ;httpd:latest ;
通过命令行安装的其他镜像(这里不得不感谢一些玩路由器的牛人 ?),比如MySQL,Tomcat,
docker run -it \
  -e 'MYSQL_ROOT_PASSWORD=root' \
  -e 'MYSQL_DATABASE=identity' \
  -e 'MYSQL_USER=identity' \
  -e 'MYSQL_PASSWORD=root' \
  -p '3306:3306' \
  --name mysql \
  beercan1989/arm-mysql:latest
docker run -it --restart=always -p 8888:8080 --name tomcat9 arm64v8/tomcat:9.0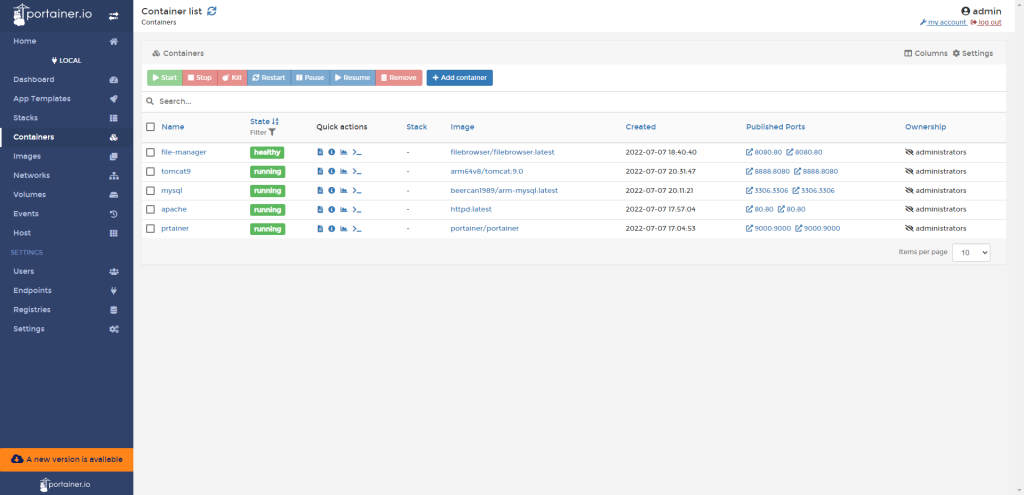
3,其他有用的工具
apt install htop    // 用于CPU内存等性能监控
apt install bmon    // 用于网络等性能监控
bmon -p eht0 ; htop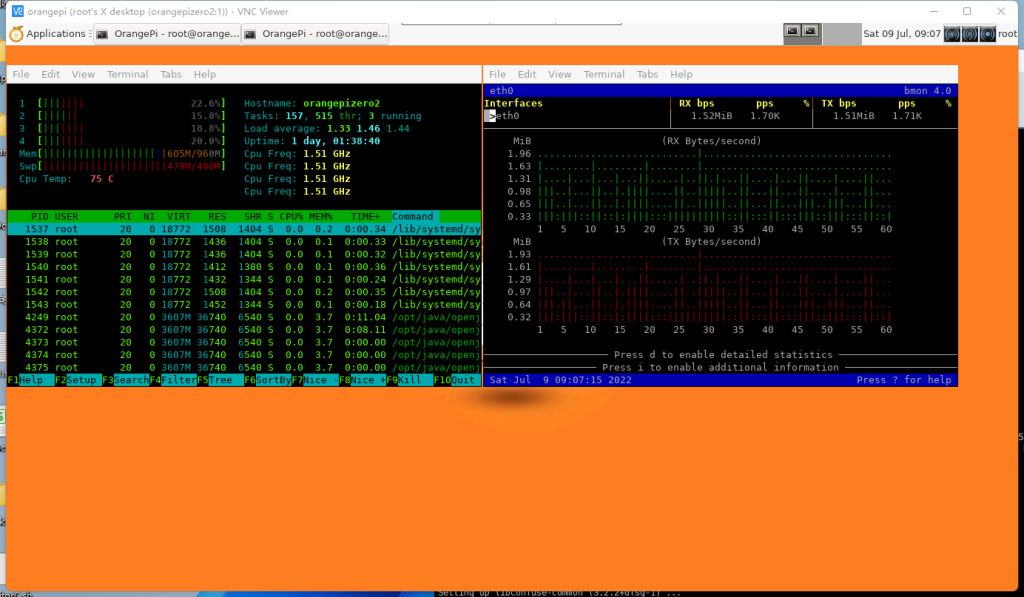
使用 Prometheus 监控 机器情况
参考站点: https://github.com/prometheus/node_exporter/releases/ ; https://pimylifeup.com/raspberry-pi-prometheus/ ;https://rizkyrajitha.xyz/post/setup-prometheus-and-grafana-on-orange-pi/ ;
安装方式
wget https://github.com/prometheus/prometheus/releases/download/v2.36.2/prometheus-2.36.2.linux-arm64.tar.gz
tar -xzvf prometheus-2.36.2.linux-arm64.tar.gz
cd prometheus-2.36.2.linux-arm64/
cp prometheus /usr/local/bin/
编辑启动Service
sudo vi /etc/systemd/system/prometheus.service
[Unit]
Description=Prometheus monitoring
Wants=network-online.target
After=network-online.target

[Service]
Type=simple
ExecStart=/usr/local/bin/prometheus \
                    --config.file /root/prometheus-2.36.2.linux-arm64/prometheus.yml \
                    --storage.tsdb.path=/root/prometheus-2.36.2.linux-arm64/data

Restart=always

[Install]
WantedBy=multi-user.target
重启:
sudo systemctl daemon-reload
sudo systemctl enable prometheus
sudo systemctl restart prometheus
sudo systemctl status prometheus
配置 node_exporter ,方式类似
wget https://github.com/prometheus/node_exporter/releases/download/v1.3.1/node_exporter-1.3.1.linux-arm64.tar.gz   //下载

tar -xzvf node_exporter-1.2.0.linux-armv7.tar.gz node_exporter-1.2.0.linux-armv7/
cd node_exporter-1.2.0.linux-armv7/  //解压
sudo cp node_exporter  /usr/local/bin/    //复制到bin

sudo vi /etc/systemd/system/nodeexporter.service  //修改配置
------------------------------------------------
[Unit]
Description=node exporter for node monitoring
Wants=network-online.target
After=network-online.target

[Service]
Type=simple
ExecStart=/usr/local/bin/node_exporter
Restart=always

[Install]
WantedBy=multi-user.target
-------------------------------------------------

//重启
sudo systemctl daemon-reload
sudo systemctl enable nodeexporter
sudo systemctl restart nodeexporter
sudo systemctl status nodeexporter
有用的查询表达式:
CPU
avg without(cpu) (rate(node_cpu_seconds_total{instance=”localhost:9100″, mode!=”idle”}[1m]))
avg without(cpu) (rate(process_cpu_seconds_total{mode!=”idle”}[1m]))
内存
node_memory_MemTotal_bytes – node_memory_MemAvailable_bytes
硬盘IO
rate(node_disk_io_time_seconds_total[1m])
网络
rate(node_network_receive_bytes_total{device=”eth0″}[5m])
参考站点:
https://prometheus.io/docs/prometheus/latest/querying/examples/
https://qiita.com/Esfahan/items/01833c1592910fb11858
另一个简单点一步到位的监测工具( 站点: https://www.monitorix.org/doc-debian.html)
apt-get update
apt-get install monitorix
service monitorix restart
//如果需要修改端口啥的 修改下配置文件 /etc/monitorix/monitorix.conf